In the last blog, we looked at articulating intent and defining your organisational purpose, which defines the value that is delivered to your clients.
We are now going to look into the processes and practises that are instrumental to the delivery of your purpose.
So, if we want to build a robust management system that achieves that there are two key stages or steps:
- Developing your Core Activity Map
- Developing your operational flowcharts
Exploring each of the steps in a little more detail:
Know the flow #1 - Developing your Core Activity Map
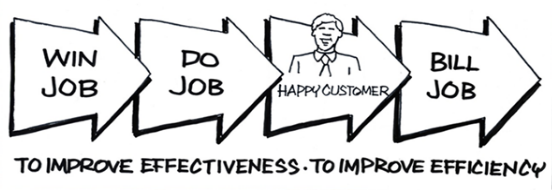
The Core Activity Map, as the name suggests, shows the core activities that the company gets paid for, so it is important that these activities are the focus of all efforts. It is these processes that we want to make better, slicker and faster as these are the activities that deliver value to the customer. In some circles, these processes are called “the value chain”.
This is a different diagram to the traditional organisation chart; essentially, it cuts a line through the organisation chart to show how the organisation delivers value.
But, digressing slightly for a moment; have you ever thought about who, when and why the traditional “picture” of an organisation, the family tree, was first invented?
The first recorded use of an organisation chart was after a train crash in Massachusetts in 1841. An investigation was headed by a Major Whistler in order to establish the causes of the accident. Major Whistler designed the first organisation chart to describe functional responsibility with the sole purpose of apportioning blame, should another incident occur!
To this day, the focus of the organisation chart remains control; that is, to ensure people do their jobs and do them properly. Nearly two centuries later and we are still employing the same thinking! Additionally, as has been noted by Prof. John Seddon, “if we design work into functions and give each function its own target, should we be surprised if the functions don’t co-operate with one another”.
That’s not to say that the organisation chart is without merit, but research has suggested there is a better diagram which supports a more enlightened approach delivering a more sustained performance.
We call this the Core Activity Map and most companies have just a few core processes, for instance:
So what does a real Core Activity Map™ look like?
Core Activity Map™ real life examples
Example #1
The example below was created with the senior team of a company designing and manufacturing electronic products that manage and control the environment within buildings. Their Core Activity Map was developed as follows:
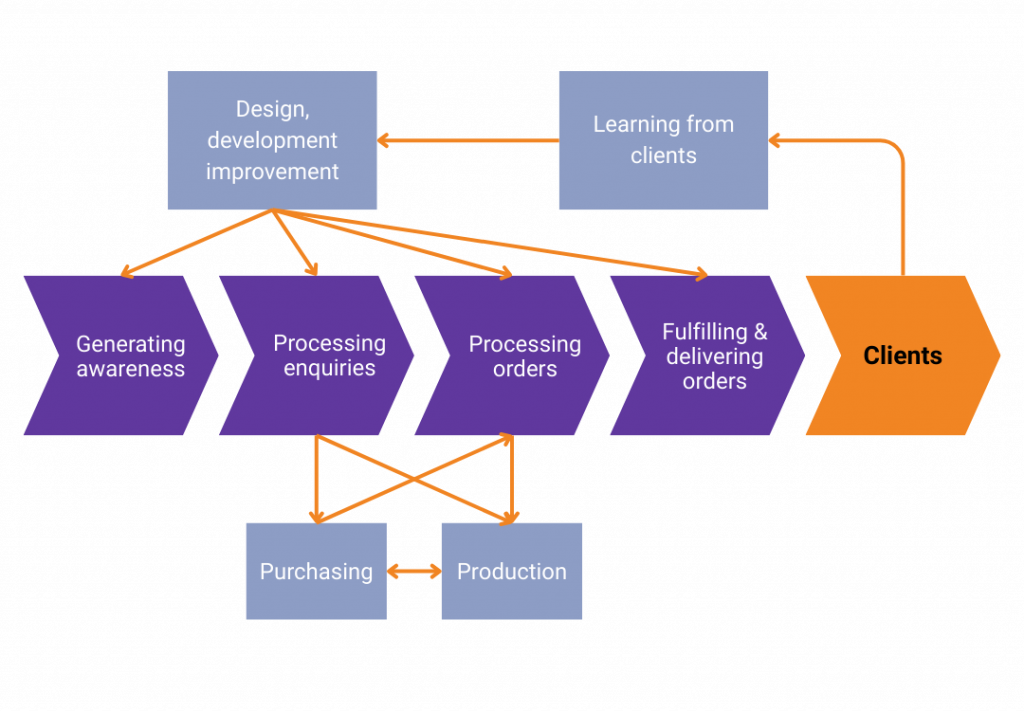
In fact, you’ll notice that “production” is seen outside of the core delivery processes. The company had always considered themselves a manufacturer of products, and indeed they still do, but in going through this process they came to the realisation that their internal production department, which was producing only about 20% of the product sold, could be treated exactly the same way as any other supplier.
As a result, they pulled production out of the “flow” of activities and treated the production department as any other supplier. In doing so, they greatly simplified a variety of measurement and management systems and processes, including KPI reporting.
Example #2
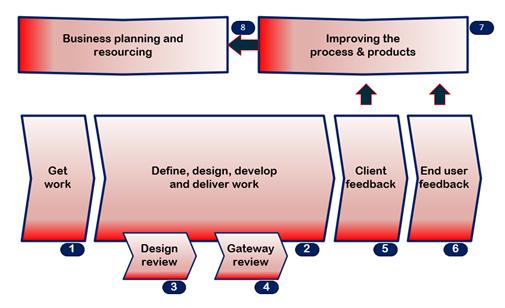
The second example shows the key business processes for an medium sized architectural practice based on the South Coast. The define, design, develop and deliver work process was then constructed around the various stages outlined in the RIBA (Royal Institution of British Architects) guide.
Example #3
It also ought to be noted that many companies may also have more than one core activity. In the example below, there are two radically different product lines which are sold and manufactured in distinctly different ways.
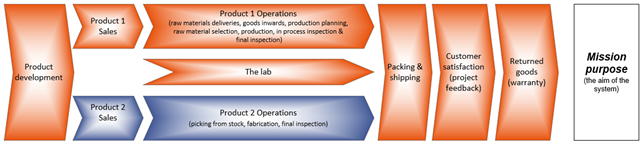
This “multiple core activity approach” applies as much to service companies as it does to manufacturing companies. For instance, a financial services company focused on high net worth individuals would have a completely different process for on-boarding new clients, a process which is often accompanied and secured by some kind of “project” is a process radically different to the activities employed for the regular reviews undertaken with existing clients.
Example #4
The final example shows the Core Activity Map for a company involved in the production of bus shelters.
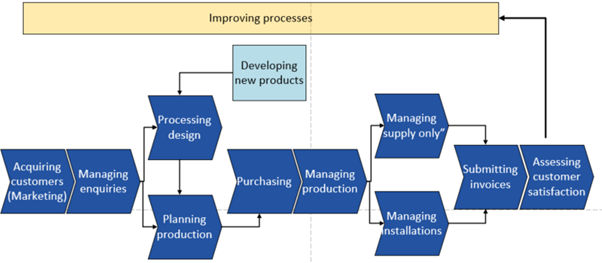
By way of illustrating a point, in the above example, the new product requirement process is seen separate to the process design activity. New product development could also, logically, be placed after marketing, or after assessing customer satisfaction, or indeed as a completely separate supporting process.
The key point here is that the flow of activities undertaken in your organisation and how you and your people perceive them will be completely unique. The Core Activity Map needs to reflect the way you see your work working.
Know the flow #2 - Developing the lower-level flow charts
Now the Core Activity Map has been fully constructed and agreed, we can flesh out some of the lower level detail.
This is where we get into the traditional “meat” of a management system. The majority of systems regardless of whether they are quality, environmental, safety or of any other orientation, usually start with a flow chart.
The flowchart usually shows:
- The people involved in the process – along the top of the chart;
- The tasks undertaken and by whom (the boxes);
- The key decisions (the diamonds) and who makes them;
- The flow of activities / interactions between people and departments.
The key point is that these flowcharts are absolutely NOT about “departments” but instead about the “process”. The sales process might include inputs from all sorts of other departments, for instance; design, engineering, estimating, legal, production, operations etc. The key is to understand all the interactions undertaken as part of the relevant process.
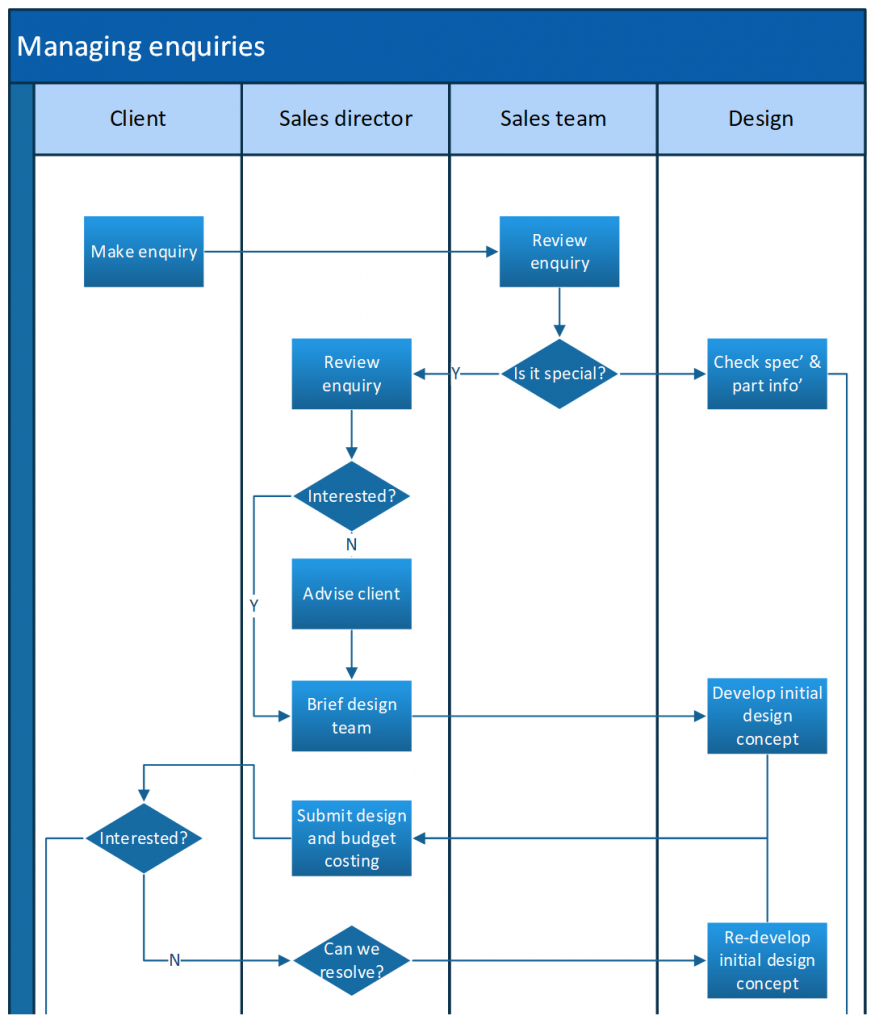
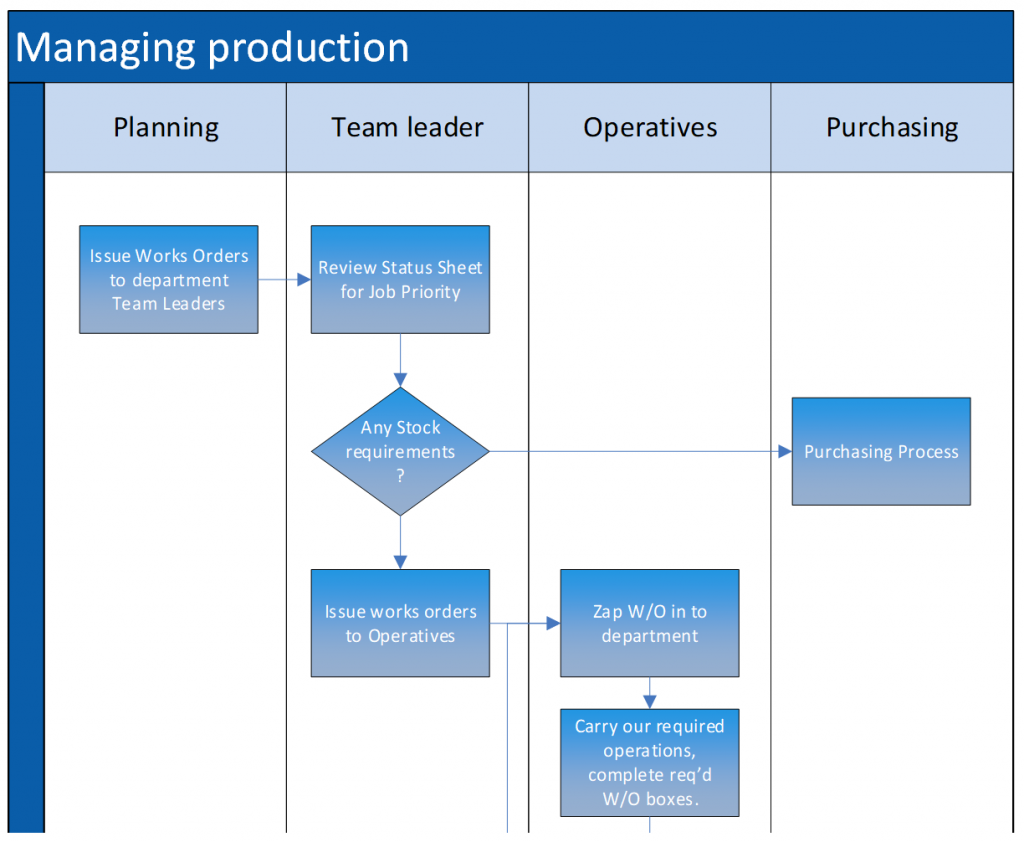
The example (pastiche) flow charts above and below begin to flesh out the detail of the actual activities that are undertaken.
The flowchart would normally be the first page of each procedure, and the detail of the procedure would typically then be developed with the following headings:
- Purpose
- Key performance indicators
- Inputs (to the process)
- Process risks and opportunities
- Process narrative (as required)
- Outputs
Once the flow charts are in place the issues relevant to the type of management system being implemented can be explored in detail, these include:
- Quality
- The sequence and detail of the activities being undertaken and what information is passed around and shared in order to get the job done.
- Health and safety
- The hazards and risks that staff, customers and the public might be exposed to in undertaking each task. These would then be developed into separate risk assessments and method statements.
- Environmental
- The environmental aspects and impacts associated with each of the tasks. In a service / office environment, this might simply be electricity, gas and water, in a production environment this might include, chemicals, contaminated waste and discharges to air, water and land
- Information security
- Information security includes both hard and soft copy information required for each task, where it has come from and the vulnerability and threats associated with each item of information.
Conclusion
The archetypal organisational diagram is the family tree and it is now nearly 200 years after its original invention, so we think the core activity map provides a much better diagram, especially when we consider that most organisations want to make their processes better slicker and quicker.
The core activity map and knowing the flow allows you to see the minutiae of how different processes interact and therefore any waste in the system. Understanding your core activities using a map of this nature allows you to remove waste from the system especially when used with other tools and techniques like lean and agile.